
|
Graphs |
|
|
Graphs |
When you request results in graphical form, they are presented in graph windows. You can open several simultaneous graph windows, showing different results, and tile them on the screen together with 3D views and text results windows. To adjust a graph's properties (range of axes, colours, etc.) see the help topic on modifying graphs.
Graphs have a popup menu that provides the following facilities:
Graphs of simulation results are updated automatically as the simulation progresses. Also, they are kept even if you reset the simulation, so once you have set up a set of interesting graphs you can edit the model and re-run the simulation to see the effect of changing the model.
You can also set up results graphs when in reset state, prior to running a simulation – the graph will be empty initially and will grow as the simulation progresses. Note that we do not recommend this for graphs of line clearance, however, since updating them can significantly slow down the simulation.
The workspace feature provides a very powerful way of managing collections of related graphs.
When a replay is in progress the replay time is indicated on both time history and XY graphs.
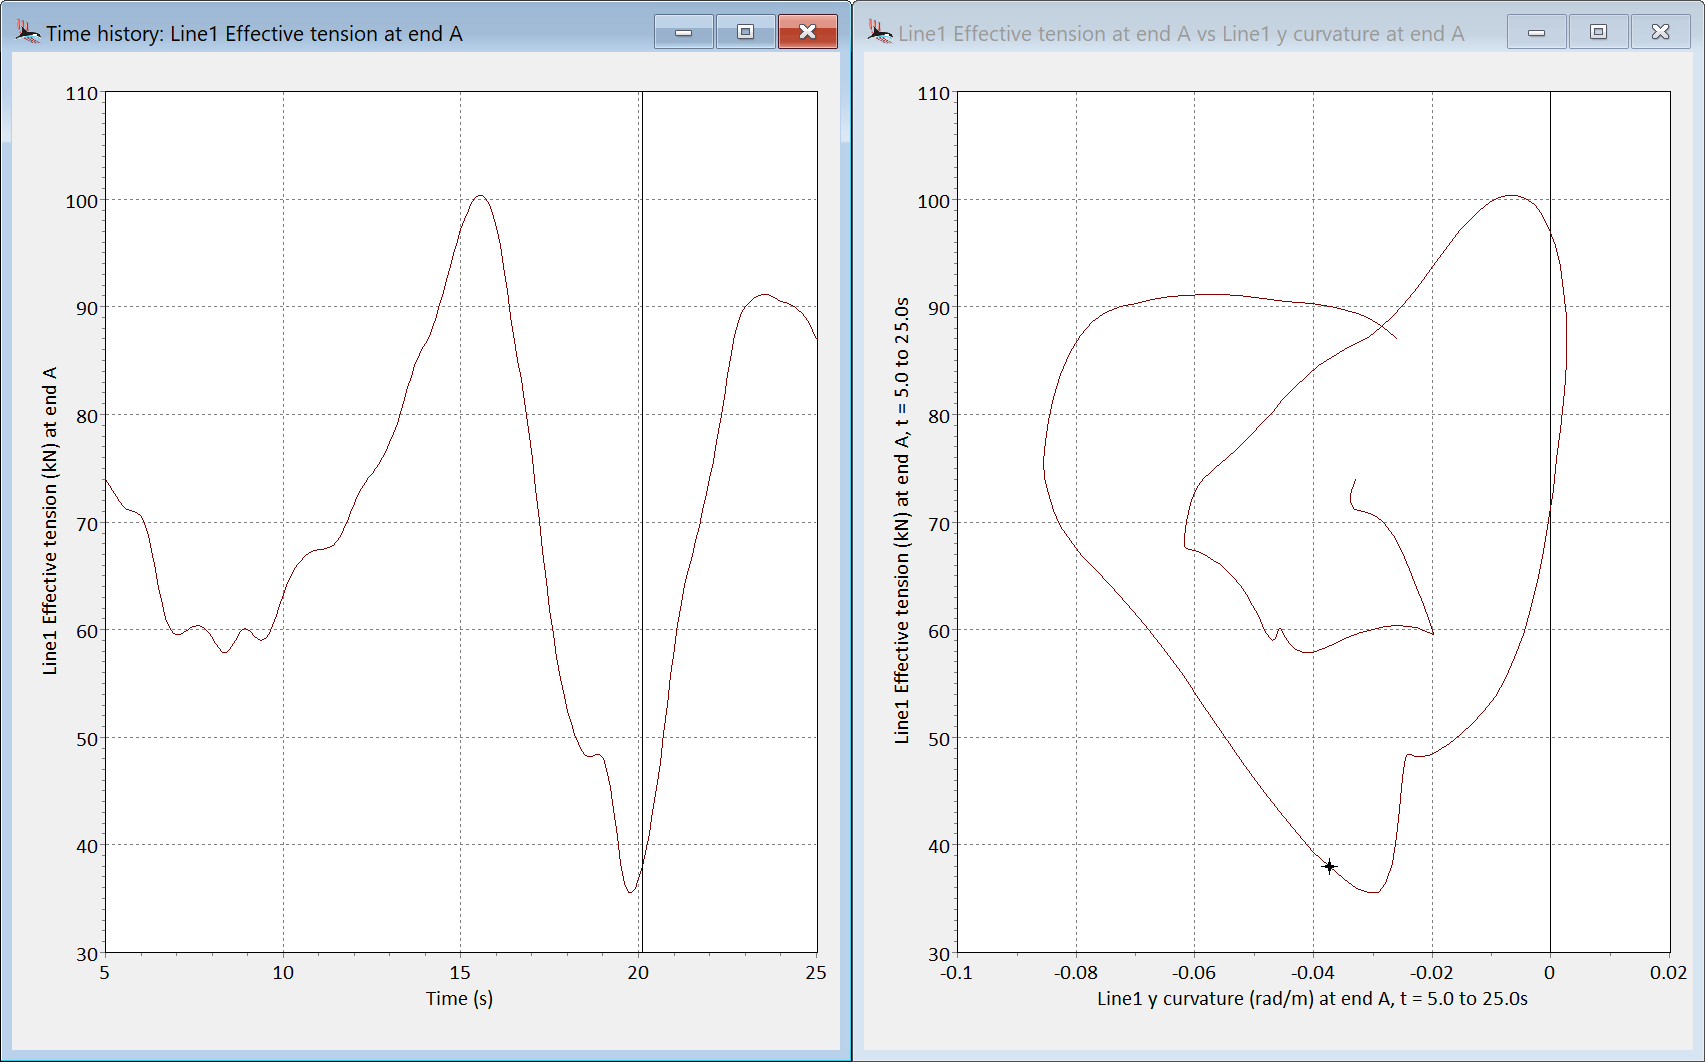
| Figure: | Replay time indicator on a time history graph (vertical line at time=16s) and on an XY graph (grey cross in bottom right of the graph). |
The replay time indicator on a time history graph can be directly manipulated using the mouse. With the CTRL key pressed you simply click on a time history graph and the indicator moves to where you have clicked. Any open 3D views are updated to show the new replay time. Similarly, with the CTRL key pressed you can click and then drag the indicator. This direct manipulation of the replay time indicator is designed to help understand and visualise how your model is behaving at key moments of the simulation.
To print a graph, use the File | Print menu item. When printing to a monochrome printer you will get the best results by setting the monochrome output preference.
You can also copy a graph to the clipboard – simply select the graph window by clicking on it and then using the Edit | Copy menu item. From the clipboard you can then paste it into another application, for instance into a word processor document. Graphs can also be exported using the popup menu.
| Note: | When copying a graph to the clipboard, the size of the graph window you copy from has an effect on how the text label fonts appear when the graph is pasted into another application. For example, if you are copying a graph to a word processor and want the graph to be full page size, then the graph window should be made large on screen (e.g. maximised). If you want a number of graphs on one page of a document then the graph should be smaller on screen – try tiling or cascading the windows (see the window menu). By experimenting with various differently sized graphs it should be possible to arrange for the fonts to appear as you wish. |