
|
Results: Cycle histograms |
|
|
Results: Cycle histograms |
These graphs plot a histogram of the rainflow cycle counts for the selected result, generated as follows:
The histogram display can be customised from the options panel which can be opened by clicking on the arrow in the bottom right of the window, as highlighted in the image below:
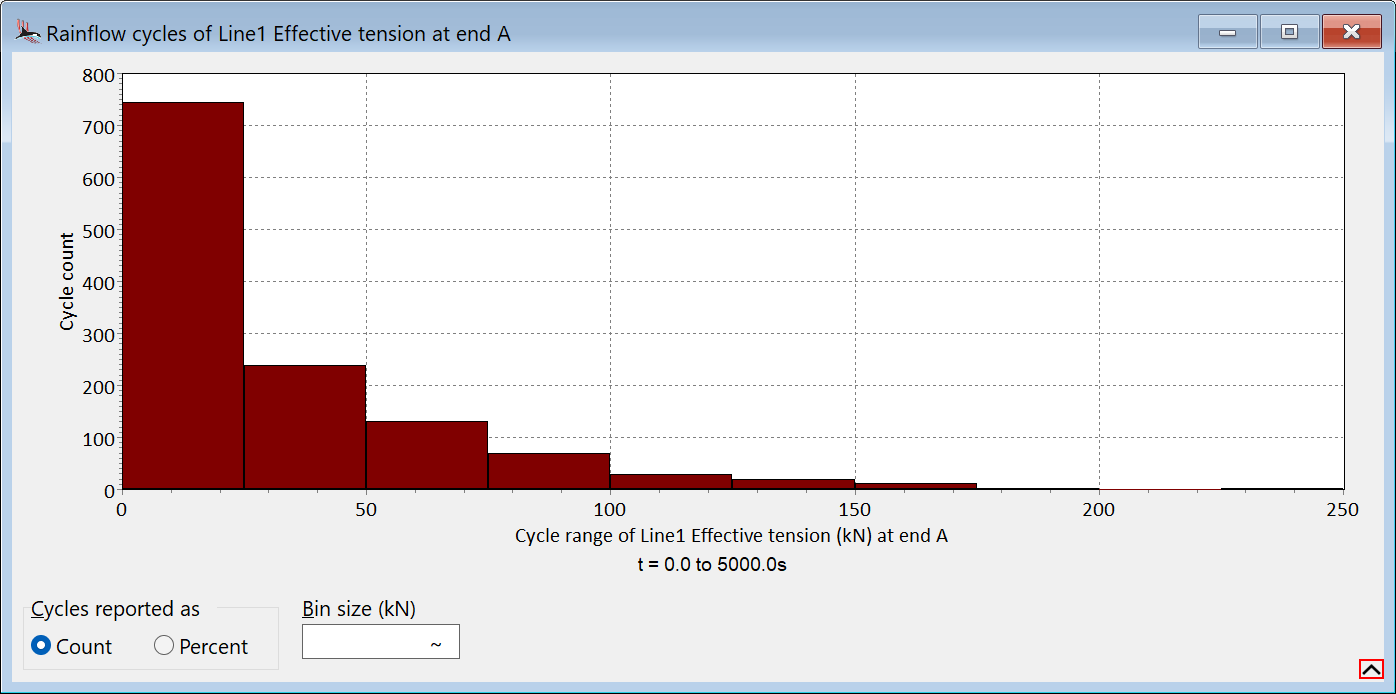
| Figure: | Cycle histogram options panel |
The options panel allows you to choose between reporting the cycles as counts or as percentages. You can also modify the bin size. A value of ~ means that OrcaFlex chooses a default bin size based on the range of the data and the total number of cycles.