Continuing our series of posts on upcoming developments for version 10.2, we consider a number of enhancements to the line clearance results.
Historically, OrcaFlex has offered results reporting the clearance between lines. These results report the shortest distance, in 3D space, between lines. Results are available for clearance between centrelines or between contact surfaces. Some OrcaFlex applications, for example riser / pipeline crossing analysis, call for clearance distances measured horizontally or vertically. A number of new results variables have been introduced in 10.2 to address these requirements.
The first new result variable we will consider is named Line Horizontal Clearance. This is essentially the same as Line Centreline Clearance, except that all coordinates are projected onto a horizontal plane before the calculation is performed. In fact that is precisely how the calculation of the result is implemented internally. Closely related to this result is Line Associated Vertical Clearance, the vertical distance between the two points that determine the horizontal clearance. These two new result variables are available either as time histories or range graphs, just as Line Centreline Clearance and Line Clearance are.
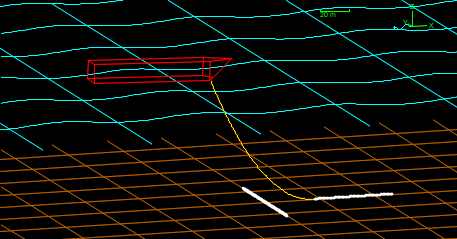
To illustrate consider the simple system shown in this view:
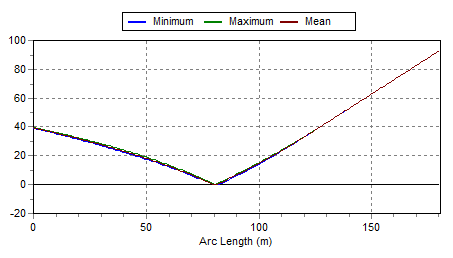
Here we have a catenary line that crosses a line on the seabed. The range graph of Line Horizontal Clearance looks like this:
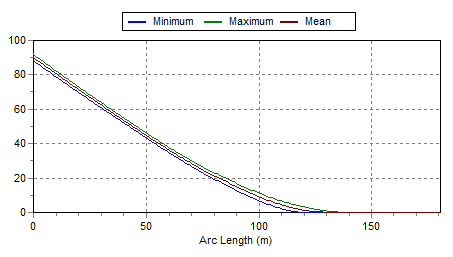
This indicates quite clearly that the crossing point is at an arc length of around 80m. The range graph for Line Associated Vertical Clearance is:
Note that the vertical clearance is zero for the final part of the graph, representing that section of the catenary line that is touching down on the horizontal seabed. The more interesting values are those corresponding to the crossing point, around arc length 80m. These values can readily be obtained using just the new results, but doing so involves a couple of steps:
- Find the arc length where Line Horizontal Clearance has its minimum.
- Read the value of Line Associated Vertical Clearance at that arc length.
To make this process simpler we have introduced what we term Whole Line Clearance Results. As the name hopefully suggests, these results are reported for the whole line as opposed to at a specific point on the line. Consequently the selected position on the line is ignored for whole line clearance results. Because whole line clearance results consider the entire line, they are not available as range graphs.
Whole Line Horizontal Clearance is defined to be the minimum, taken over all points on the line, of Line Horizontal Clearance. For our example, it looks like this:
At first glance, it looks like there is lots happening here, but look at the scale of the y-axis. This is just a graph of zeros, subject to floating point machine precision. This is entirely reasonable since we know that there is always a crossing point.
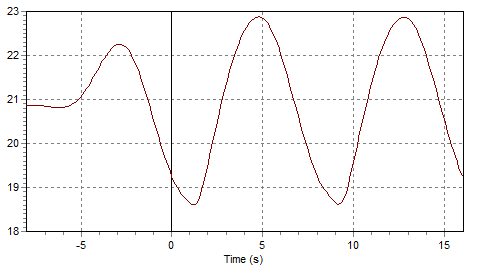
Whole Line Associated Vertical Clearance is defined slightly differently. It is defined to be the vertical distance between the two points that determine the Whole Line Horizontal Clearance. For our example the graph is like so:
The minimum of this time history would give us a single vertical clearance value for this simulation.
Having added whole line clearance results for horizontal and vertical clearance, we decided to do the same for the other clearance results. Whole Line Centreline Clearance reports the minimum, taken over all points on the line, of Line Centreline Clearance. Whole Line Clearance is defined analogously.


